When running workloads on Kubernetes in Azure you probably want some insights in how your cluster and pods are behaving. In this blogpost I will setup Prometheus and Grafana to get a dashboard going. This post assumes you have a Kubernetes cluster running and configured kubectl to connect to it.
Installing Prometheus
Lets start with deploy the configuration for Prometheus using a config map using :
kubectl create -f prometheus-config-map.yaml
You can find the code for a example config file on Github
Next we deploy Prometheus itself using a Kubernetes yaml file. Create a file named prometheus-deployment.yaml and paste in the following content
1 | apiVersion: extensions/v1beta1 |
Deploy this file using:
kubectl create -f prometheus-deployment.yaml
We can now check the deployment status using
kubectl get deployment
When the deployment is complete and the Prometheus pod is running we can visit the Prometheus UI using port-forwarding. First get the pod name using kubectl get pods. Then using:
kubectl port-forward prometheus_pod_name 9090:9090
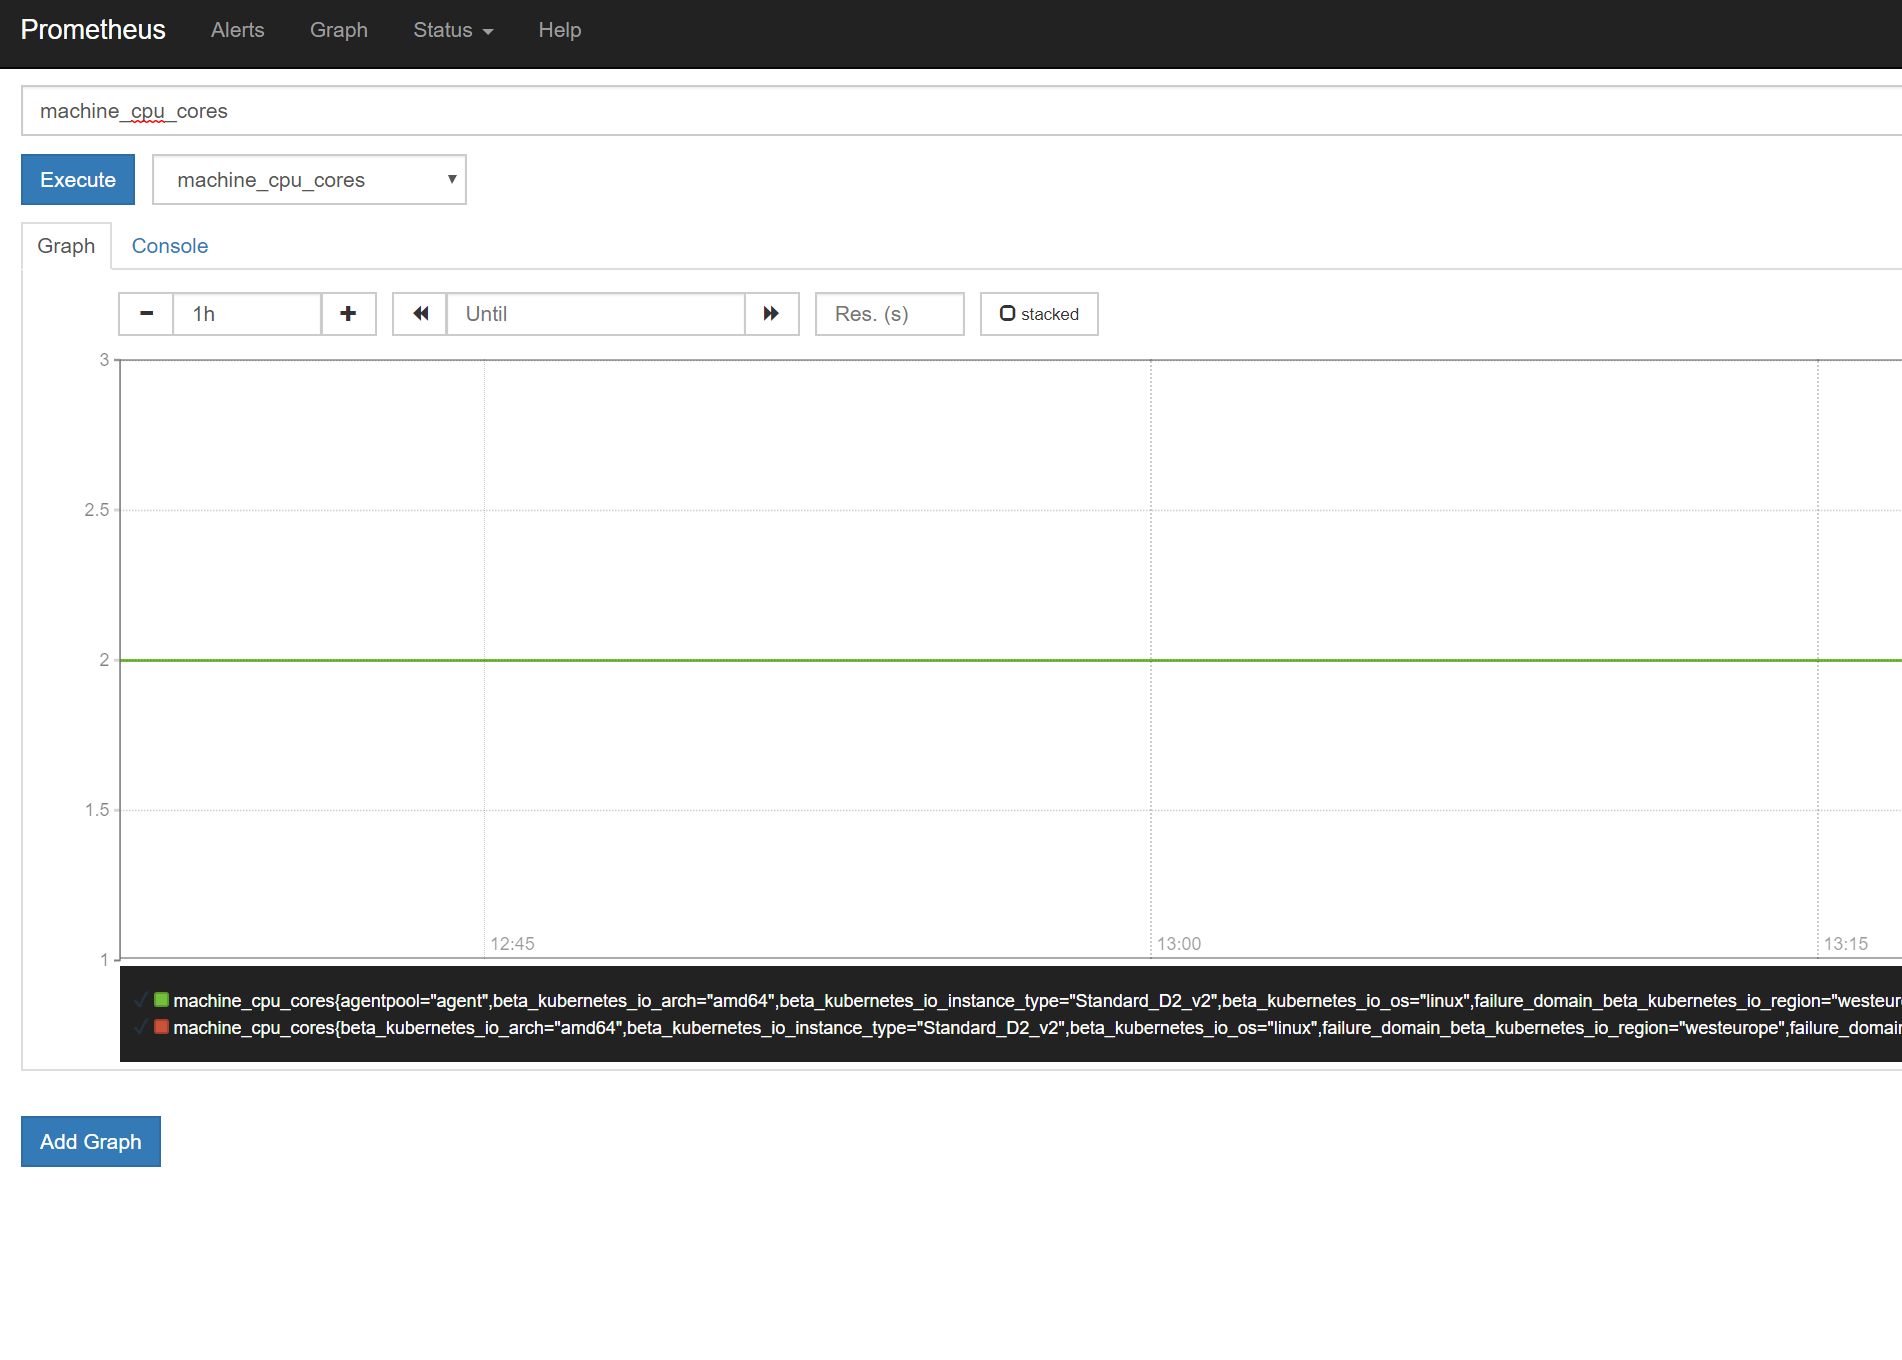
we can visit http://127.0.0.1:9090 and we should see the Prometheus user interface. This should look like this . But using the standard Prometheus UI to monitor your cluster is not something that is really user friendly. So lets add Grafana as a dashboard for our Prometheus logging.
Installing Grafana
We are going to add Grafana to our cluster using Helm and Tiller. Helm and Helm charts are allow for predefined Kubernetes apps. You can find more on https://kubeapps.com/. Initialize helm using helm init. When helm is initialized we can use helm install --name my-grafana stable/grafana. This will deploy Grafana to the Kubernetes cluster using Helm and Tiller. Again we can check the deployment of Grafana using kubectl get deployment. If everything works as it should then you will get some instructions on how to get the admin password for Grafana. It will be something like
kubectl get secret –namespace default my-grafana-grafana -o jsonpath=”{.data.grafana-admin-password}” | base64 –decode ; echo
Save this password because you need it to login to Grafana later on.
Because we do not want to add a specific Prometheus pod on the Kubernetes cluster as datasource in Grafana (even though it does work) we add a Kubernetes service using the following YAML
1 | apiVersion: v1 |
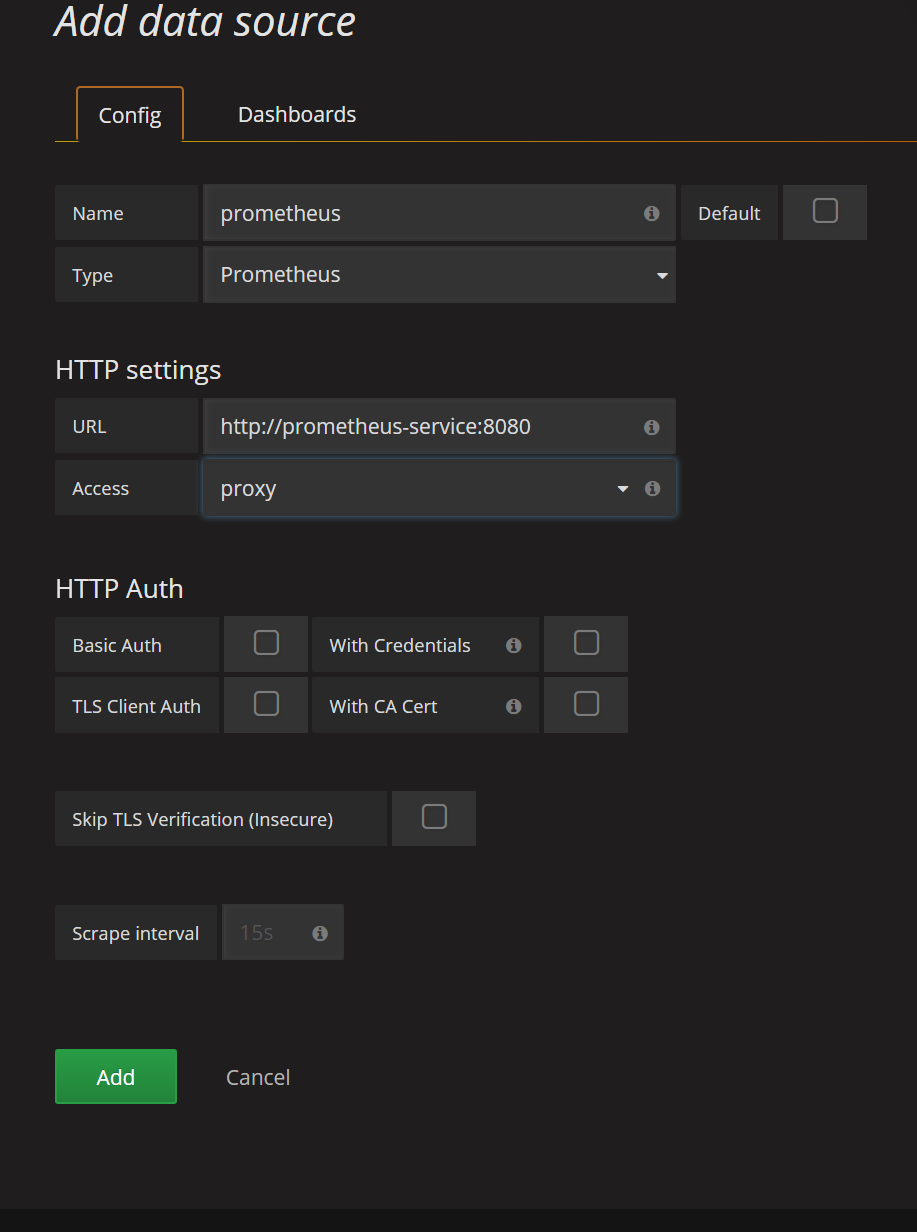
When we now list the services using kubectl get svc. Now we have the name of the svc and the port. In this case the URL is http://prometheus-service:8080. This URL can be used later to add Prometheus as a datasource in Grafana.
Setting up Grafana
The last part is to setup Grafana. The default install we used for installing Grafana using Helm does not include a public IP adress for Grafana. So we have to use a kubectl port forward to connect to Grafana.
kubectl port-forward my-grafana-pod-name 3000:3000
By visiting http://127.0.0.1:3000 we can now configure Grafana. Log in to Grafana using admin and the password we retrieved earlier. Inside Grafana add a datasource using the Prometheus service URL.

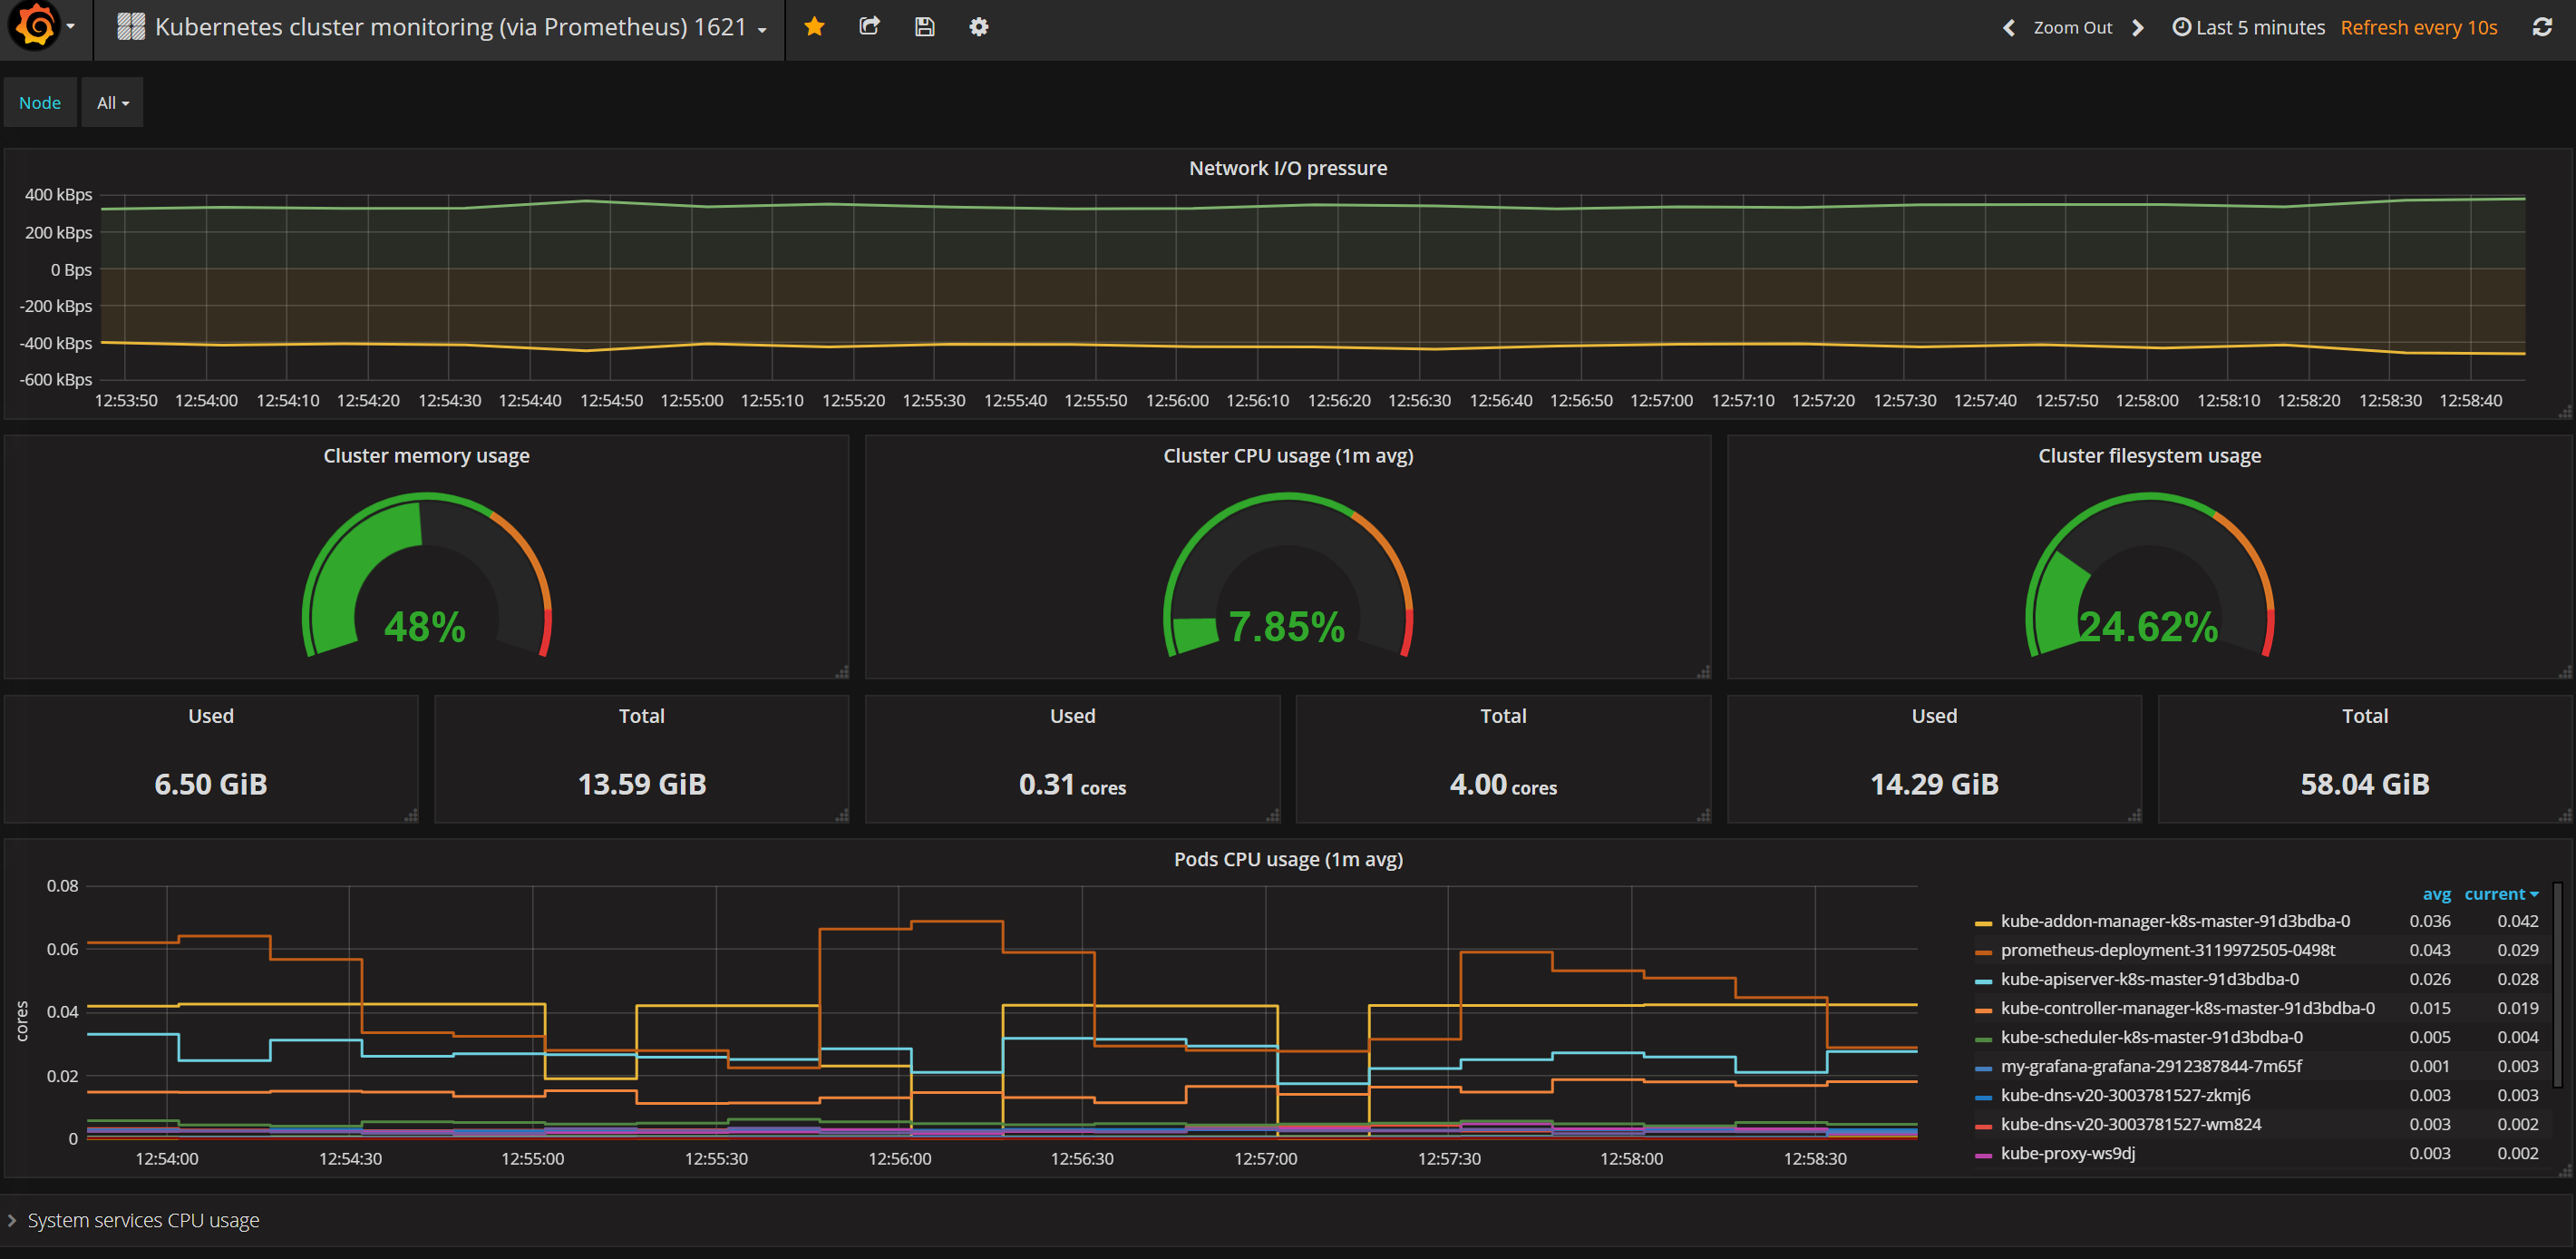
After the datasource has been added it is finally time to add a dashboard. Goto import dashboards inside and import a dashboard using ID 1621. Grafana dashboards can be shared on Grafana dashboards. Using this dashboard ID in the import and choosing our Prometheus datasource we created earlier we should now see our first Grafana dashboard.

Happy dashboarding!